Every day our little server here at ANR Communication Services performs hundreds of "little" tasks automatically and without complaint. These are different from the usual tasks of a web server. These tasks range from simple items like sending out e-mails to more complex tasks like gathering data and processing it for immediate publication to a website. All of which work flawlessly except on rare occasions where a little intervention is needed.
Some of the data we gather every day comes from the most unlikely places. I'd like to highlight a couple of the services we provide from this data but probably more interesting is the journey of the information itself. Hold on to your hats as we head down the data trail! I'll do my best to keep this from being boring!
For many years now we've been collecting
CIMIS data. This is basically hourly weather and temperature data from over 100 weather stations around California. The data itself is gathered from each weather station and stored in databases at CIMIS where the data is then downloaded and used for many diverse applications. Every morning we download the data, patch up any missing data, process it and push it out to the
Fruit and Nut Weather related Models web site. Every morning we process over 17,000 individual pieces of temperature data multiple times. The data we download is the past 7 days worth of data. Every day that data is updated. We do this in case there were errors in the data coming from CIMIS. Take a look at some of the weather models. They may not make much sense if your not familiar with them but they are a huge help to farmers, particularly those with orchards.
We recently began gathering Fire Data from the US Forest Service. The name they have for this is
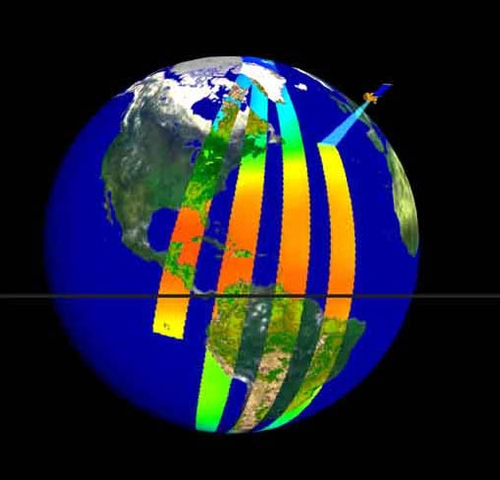
MODIS Active Fire Mapping Program. The journey begins with 2 NASA EOS satellites Terra (launched 1999) and Aqua (2002). These satellites can be tracked through NASA's
Satellite tracking. A word of Warning... It's hard finding the satellites in the list. From these satellites pictures are taken of the earth that show the earth's temperature. From the satellite photos, large fires can be determined from the "hot spots" in the images. US Forest Service collects information for fires in the US, Canada, and Hawaii only.

NASA recieves the data from the satellite. The data is then processed by NASA for hundreds of uses. Get surface temperatures, water temperatures, identify vegetation density, cloud density, and many more... One of them it to recognize "hot spots" and identify them as fires. The fires are then placed into a database for others to use. The US Forestry service takes this fire data and processes it for their own use. They name the fires and add detailed information such as who is fighting the fire and fire crews, containment, and so on. The data we download is only the fire locations. Unfortunately, the US Forest service keeps the name of the fires and other details in their own database. We receive the information in the form of GIS shape files all zipped up into one big zip file. These shape files must first be unzipped, then converted to text data so that we can put it into our database.
The image below was created by NASA from photo's taken from these satellites. The images are processed to show where vegetation is, where the burn area is, where the fire is still burning. There is a lot of potential uses for this for this data from public safety and awareness, to helping firefighters fight the fires, and more.
Los Angeles Fire
All of this is done so that we can provide you with the ANR Fire Map. Currently the map is very basic. It displays daily fires from all over the US, Canada, and Hawaii in a raw unprocessed format. We have data all the way back to December 1st, 2000. My hope is to keep working on this map so that we can groups these individual points into fires, show the entire burn area, and show how they spread day by day. We are also working on other mapping applications. Repository items can be Geo-tagged, marking location by a point or an area, and their locations can be viewed in the Repository. Expect to see more ANR Maps in the future!
I call this the "Trickle Down Effect"; where information that cost thousands to billions of dollars to gather is organized and trickled down so that the even ANR Communication Services may freely use this information to serve the public. This is yet another example of some of the benefits we reap from things like the NASA space program, this and "Post-it Notes". However, "Post-it Notes" is a different story all together!
Don't forget to check out the ANR Fire Map!


